AWS Security Blog
Deploy a dashboard for AWS WAF with minimal effort
September 8, 2023: It’s important to know that if you activate user sign-up in your user pool, anyone on the internet can sign up for an account and sign in to your apps. Don’t enable self-registration in your user pool unless you want to open your app to allow users to sign up.
January 24, 2023: This post was republished to update the code, architecture, and narrative.
September 9, 2021: The Amazon service has been renamed to Amazon OpenSearch Service. See details.
In this post, we’ll show you how to deploy a solution in your Amazon Web Services (AWS) account that will provide a fully automated dashboard for AWS WAF, a web application firewall that helps protect your web applications or APIs against common web exploits.
Having good visibility into what is being blocked by web access control lists (web ACLs) that are deployed to AWS WAF is important for operating your AWS WAF implementation. This visibility is useful for threat intelligence, hardening rules, troubleshooting false positives, and responding to an incident. Therefore, it’s common to build custom dashboards based on AWS WAF logs, to provide a near real-time view of your application security and provide access to request details when needed.
Solution overview and architecture
The solution presented in this blog post uses logs that are generated and collected by AWS WAF and displays them in a dashboard, as shown in Figure 1.
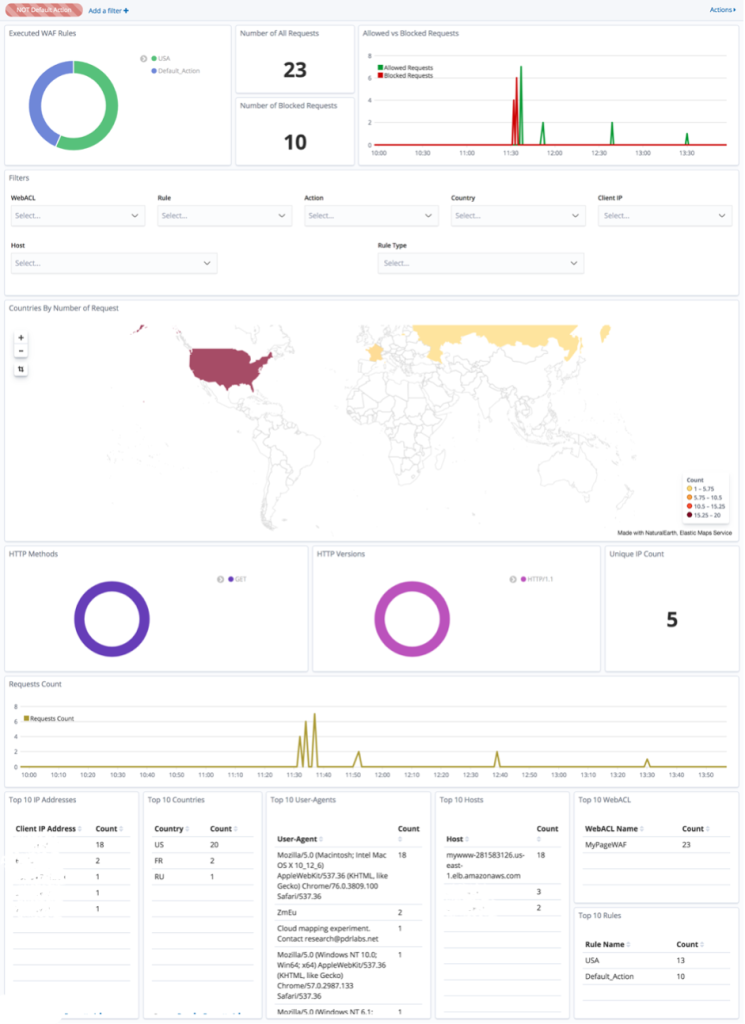
Figure 1: Example dashboard for AWS WAF
The dashboard provides multiple graphs for you to reference, filter, and adjust that are available out-of-the-box. The example in Figure 1 shows data from a sample web page, and the visualizations include:
- Launched AWS WAF rules
- Total number of HTTP requests
- Number of blocked HTTP requests
- Allowed versus blocked HTTP requests
- Number of requests per country
- HTTP methods
- HTTP versions
- Unique IP address count
- HTTP request count
- Top 10 IP addresses
- Top 10 countries
- Top 10 user-agents
- Top 10 hosts
- Top 10 web ACLs
The dashboard is created by using OpenSearch Dashboards, which gives you the flexibility to add new diagrams and visualizations. To get ideas for new visualizations, in addition to the ones shown here, see these AWS WAF logging examples.
You can deploy AWS WAF to your Application Load Balancer, Amazon CloudFront distribution, or Amazon API Gateway stages. I’ll show you how you can use this solution to get more insight into what’s happening at the AWS WAF layer. AWS WAF provides two versions of the service: AWS WAF (which is now in version 2) and AWS WAF Classic. We recommend using version 2 of AWS WAF to stay up to date with the latest features. The solution described in this blog post works with both AWS WAF versions.
The architecture of the solution is broken down into seven steps, which are outlined in Figure 2.
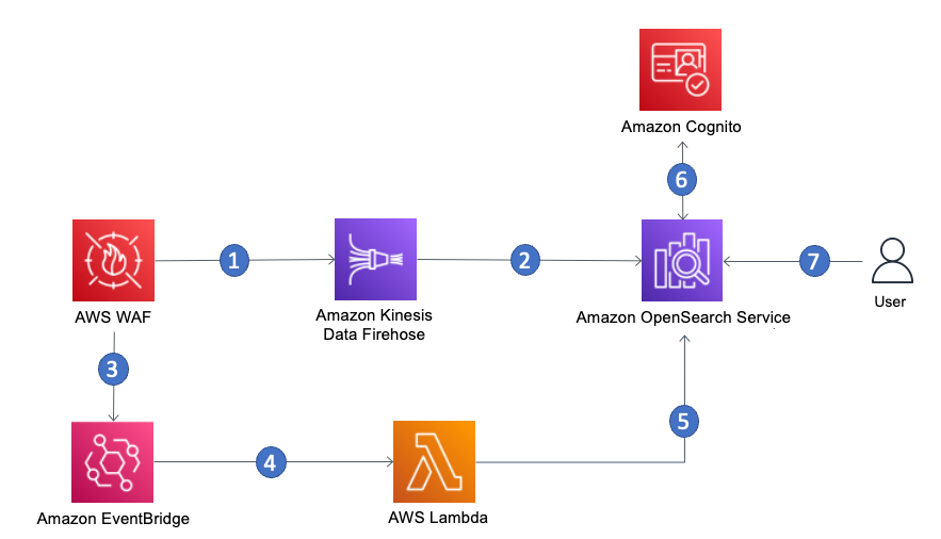
Figure 2: Workflow steps for the AWS WAF dashboard solution
The workflow steps are as follows:
- AWS WAF logs capture information about blocked and allowed requests. These logs are forwarded to Amazon Kinesis Data Firehose.
- The Kinesis Data Firehose buffer receives the logs and then sends those to Amazon OpenSearch Service—the core service of the solution.
- Some information, like the names of AWS WAF web ACLs, isn’t provided in the AWS WAF logs. To make the solution more user friendly, EventBridge is called whenever a user changes their configuration of AWS WAF.
- Amazon EventBridge calls an AWS Lambda function when a user creates new AWS WAF rules.
- Lambda retrieves the information about existing AWS WAF rules and updates the mapping between the IDs of the rules and their names in the Amazon OpenSearch Service cluster.
- Amazon Cognito stores the credentials of authorized dashboard users in order to manage solution user authentication and authorization.
Note: If you need alternative methods to Cognito for securing OpenSearch Dashboards, see the topic SAML authentication for OpenSearch Dashboards for more details.
- The user enters their credentials to access the OpenSearch Dashboard, which is installed on the Amazon OpenSearch Service cluster.
Now, let’s deploy the solution and see how it works.
Step 1: Deploy the solution by using the AWS CDK
We provide an AWS Cloud Development Kit (AWS CDK) project that you will deploy to set up the whole solution automatically in your preferred AWS account. You can find the CDK code of the solution in our AWS GitHub repository.
Use the integrated development environment (IDE) of your choice. Make sure you have set up your environment with all the prerequisites of working with the AWS CDK. This particular AWS CDK project is written in Java, so make sure to also check the prerequisites for working with the CDK in Java.
Note: You will need to launch the AWS CDK project in the us-east-1 AWS Region if you are using an AWS WAF web ACL that is associated to an Amazon CloudFront distribution. Otherwise, you have the option to launch the AWS CDK project in any AWS Region that supports the AWS services to be deployed.
After you’ve set up your environment, you’re ready to deploy the solution as follows.
To deploy the solution
- Clone the repo by running the following command.
git clone https://github.com/aws-samples/aws-waf-dashboard.git - Navigate into the cloned project folder by running the following command.
cd aws-waf-dashboards - Run the cdk commands to deploy the infrastructure.
The first time you deploy an AWS CDK app into an environment (account and AWS Region), you’ll need to install a bootstrap stack. This stack includes resources that are needed for the toolkit’s operation. For example, the stack includes an Amazon Simple Storage Services (Amazon S3) bucket that is used to store templates and assets during the deployment process.
Run the following command to bootstrap your environment.
cdk bootstrapYou should see results similar to those in Figure 3, showing that a CDK environment is being bootstrapped.

Figure 3: AWS CDK bootstrap
- After this command has completed, you can start deploying the solution. You will need to pass two parameters with your deployment command:
- The email that you will use as your username.
- The Cognito domain. You can enter the name of your choice for the Cognito domain.
Note that the Cognito domain name you choose will serve as a domain prefix for the Cognito hosted UI URL and needs to be unique. See Configuring a user pool domain in the Amazon Cognito User Guide if you need more information on Cognito domains.
Run the following command.
cdk deploy --parameters osdfwDashboardsAdminEmail=<yourEmail> --parameters osdfwCognitoDomain=<uniqueCognitoDomain>Type y and press enter when prompted if you wish to deploy the changes.
You should see an output similar to that shown in Figure 4, where you can see AWS services being created.

Figure 4: AWS CDK project deployment
There are three more optional AWS CDK deployment parameters that have default values. You can use these parameters in addition to the mandatory parameters (the email and Cognito domain). The additional parameters are the following:
- EBS size for the OpenSearch Service cluster: osdfwOsEbsSize
- Node type for the OpenSearch Service cluster: osdfwOsNodeSize
- OpenSearchDomainName: osdfwOsDomainName
This AWS CDK project will spin up multiple AWS resources, including but not limited to the following:
- An OpenSearch Service cluster with OpenSearch Dashboards for storing data and displaying the dashboard
- A Cognito user pool with a registry of users who have access to the dashboards
- A Kinesis Data Firehose for streaming logs to the OpenSearch Service
The process of launching the AWS CDK project will take 20–30 minutes. You can take a break and wait until the status of the AWS CDK deployment is complete. You can also check the status in the AWS CloudFormation service, as shown in Figure 5.
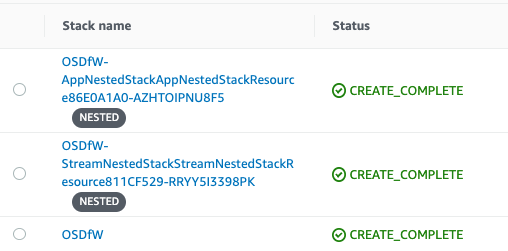
Figure 5: Completed launch of the CDK project shown in AWS CloudFormation service
Step 2: Verify that the OpenSearch dashboard works
In this step, I’ll walk you through how to test the OpenSearch dashboard.
To test the OpenSearch dashboard
- First, check the email address that you provided in the parameter for osdfwDashboardsAdminEmail. You should have received an email with the required password to log in to the OpenSearch dashboard. Make a note of it.
- Now return to the environment where you ran the AWS CDK deployment. There should be a link under Outputs, as shown in the following screenshot.

Figure 6: Output of the AWS CDK deployment
If you’ve exited the terminal where you ran the CDK commands, you can find the same link by navigating to the CloudFormation service and locating the Outputs tab in the stack called OSDfW.
- Select the link and log into the OpenSearch dashboard. Provide the email address that you set up in Step 1 and the password that was sent to it. You will be prompted to update the password.
- In the OpenSearch dashboard, choose the OpenSearch Dashboards logo (the burger icon) at the top left, as shown in Figure 7. Then under Dashboards, choose WAFDashboard. This will display the AWS WAF dashboard.

Figure 7: Navigate to the AWS WAF dashboard
The dashboard should still be empty because it hasn’t connected with AWS WAF yet, as shown in Figure 8.

Figure 8: AWS WAF dashboard with no data
Step 3: Connect AWS WAF logs
Now it’s time to enable AWS WAF logs on the web ACL for which you want to create a dashboard, and connect them to this solution. If you need instructions on how to create an AWS WAF ACL, refer to this workshop.
To connect to AWS WAF logs
- Open the AWS WAF console and choose Web ACLs. Then choose your desired web ACL. In this example, we use a previously created web ACL called webacl-wafdashboard, as shown in Figure 9.

Figure 9: Navigation to AWS WAF ACLs
- If you haven’t enabled AWS WAF logs yet, you need to do so now in order to continue. To do this, choose the Logging and metrics tab in your web ACL, and then choose Enable.
- For Amazon Kinesis Data Firehose delivery stream, select the Kinesis Firehose that was created by the template in Step 1. Its name starts with aws-waf-logs.
- Save your changes.
Step 4: Test the solution
For your testing, you can use any application that leverages AWS WAF. Your AWS WAF logs will be sent from AWS WAF through Kinesis Data Firehose directly to an Amazon OpenSearch Service cluster. The AWS WAF logs will then be visualized in OpenSearch Dashboards. After a couple of minutes, you should start seeing data on your dashboard, similar to the screenshot in Figure 1.
To illustrate the testing process, I’ll use as an example the OWASP Juice Shop. The OWASP Juice Shop is an open-source web application that is intentionally insecure, so I’ve deployed it into a test account with no important assets or connectivity to existing workloads. For more information about this application, see Pwning OWASP Juice Shop, which is a free book that explains the app and its vulnerabilities in more detail.
To test the dashboard solution by using OWASP Juice Shop
- In my example, I’ve deployed the OWASP Juice Shop. See the AWS WAF Workshop for the CloudFormation templates that I used to deploy the OWASP Juice Shop.
I then navigate to the CloudFront URL that is deployed by the CloudFormation templates, and I see the Juice Shop UI with product listings, similar to Figure 10.

Figure 10: OWASP Juice Shop
- I’ve configured an AWS WAF web ACL and have attached it to my CloudFront distribution that was created as part of the Juice Shop deployment. The CloudFront distribution is the entry point of my website. In my AWS WAF web ACL, I’ve configured AWS Managed Rules for AWS WAF, as shown in Figure 11.

Figure 11: AWS WAF Managed Rules
- I’m testing the AWS WAF dashboard by invoking the AWS WAF rules at my Juice Shop deployment by using the following simulations:
- A cross-site scripting (XSS) attack, as shown in Figure 12. (You can find the command in this AWS WAF Workshop.)

Figure 12: Blocking of cross-site scripting command
- A SQL injection attack, as shown in Figure 13. (You can find the command in this AWS WAF Workshop.)

Figure 13: Blocking of SQL injection command
- A bot control simulation, as shown in Figure 14, using the following command.
for i in {1..1000}; do curl -I -A "Mozilla/5.0 (compatible; Googlebot/2.1; +http://www.google.com/bot.html)" <my CloudFront distribution url> done
Figure 14: Bot requests blocked
- A cross-site scripting (XSS) attack, as shown in Figure 12. (You can find the command in this AWS WAF Workshop.)
As shown in the preceding screenshots, some of the requests were blocked in accordance with the AWS WAF rules that I configured. The AWS WAF dashboard solution will display blocked requests, as well as normal traffic flowing through the OWASP website. The visualization results are shown in Figure 15.
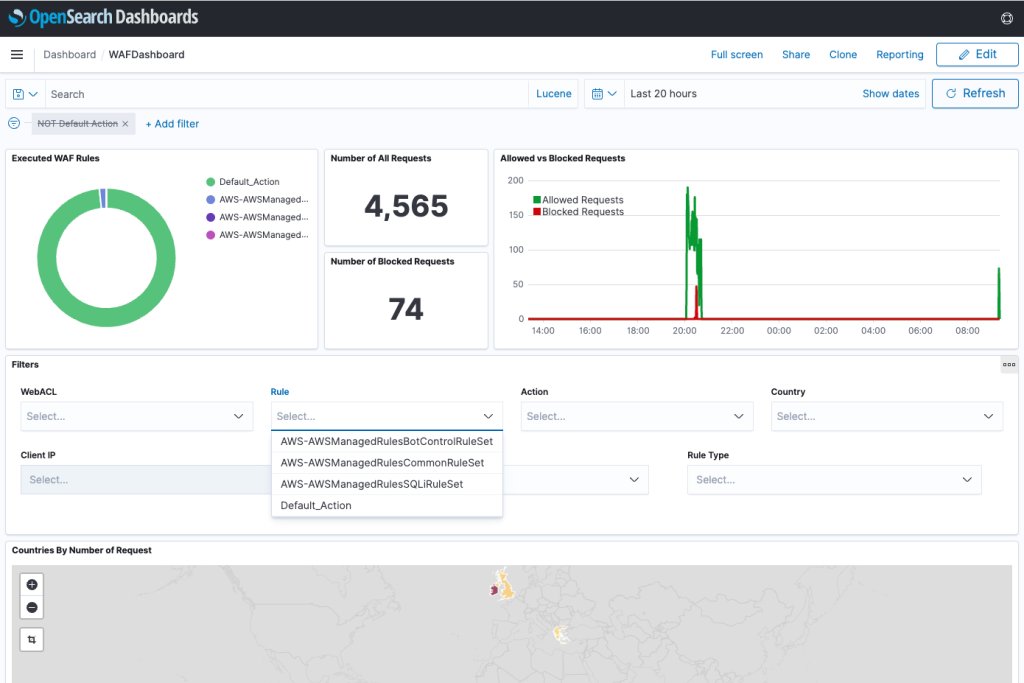
Figure 15: OpenSearch Dashboard visualized requests
Note: The Filters section in the dashboard will be populated 30 minutes after the dashboard has received data from Kinesis Data Firehose.
Clean up
To clean up the infrastructure that was deployed from the AWS CDK, make sure that you are in the cloned project directory, and run the following command.
cdk destroy
At the prompt, select y if you’re sure you want to delete.
Conclusion
In this post, we’ve detailed how you can deploy a dashboard automatically for your AWS WAF logs in order to visualize logs. This visualization will help you with threat intelligence, hardening rules, troubleshooting false positives, and responding to an incident. Now it’s your turn to deploy this solution for your own application.
There are two additional AWS Security Blog posts that provide further examples of using OpenSearch Service for log analysis and alerting. The first post focuses on using OpenSearch Service for anomaly detection in AWS WAF logs, while the second post focuses on using Amazon OpenSearch as a SIEM solution.