AWS Open Source Blog
Managing Grafana and Loki in a regulated multitenant environment
Grafana Loki was introduced in 2018 as a lightweight and cost-effective log aggregation system inspired by Prometheus. Grafana, often with Prometheus, is a popular open source platform for monitoring and observability that can be used to query, visualize, and create alerts on a number of metric and data sources.
With the increase in maturity of these products, organizations are starting to use Grafana and Grafana Loki (which we’ll refer to simply as Loki) in complex environments, often subject to data regulations. A common use case involves multitenant hosting platforms, often based on container orchestration technologies, where a certain degree of separation is required, not only for the workloads, but also for the logs produced by those applications and the possible confidential information contained in debug messages and system outputs.
Loki natively supports multitenancy; however, the configuration can be challenging to integrate in an existing Grafana environment, especially when different data sources are used within the same Loki instance.
Let’s assume, for example, that we have a single instance of Loki, either standalone or as part of a Loki/Grafana stack, and have multiple applications sending logs that need be queried and visualized in Grafana. In this article, we will explore options to configure Loki and Grafana in a multitenant regulated environment and how to work around some of the limitations. The goal is to have different “partitions” so that multiple development teams can consume the same monitoring stack, maintaining logical storage separation, and regulating which set of data each user of the platform can query from the Grafana interface.
High-level design
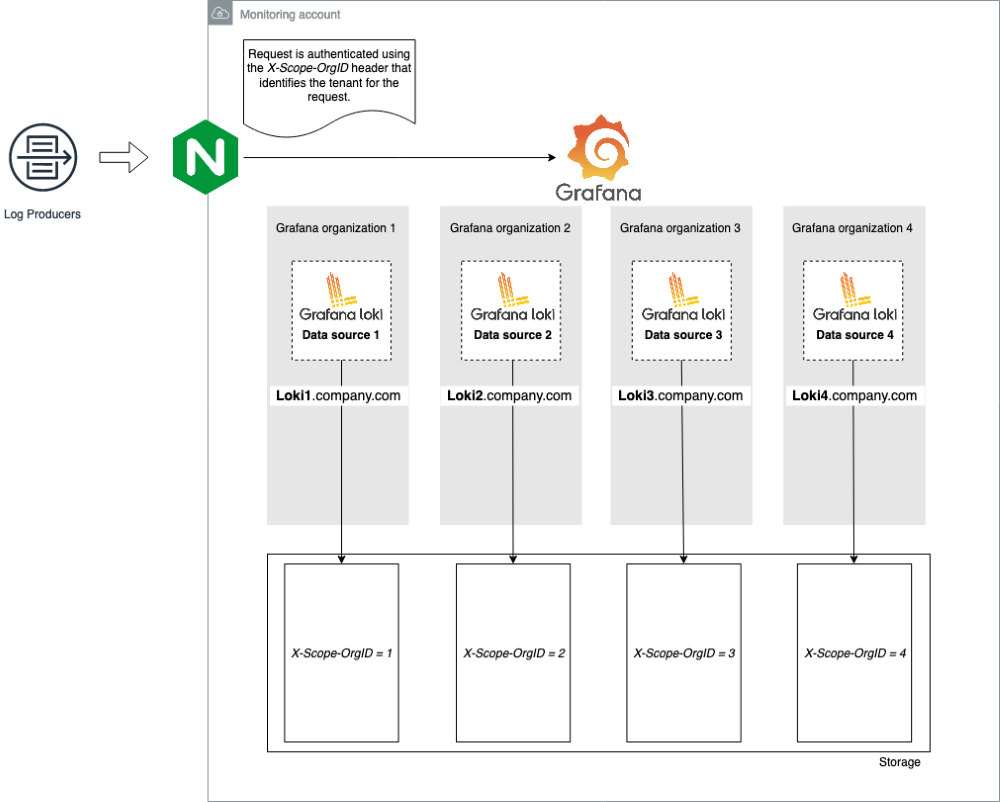
The following image shows the high-level, multitenancy setup.
Setup
To allow multitenancy, requests to the Loki API should include an HTTP header (X-Scope-OrgID) that identifies the tenant for the request. The tenant IDs can be any alphanumeric string that fits within the Go HTTP header limit (1 MB).
Note: To run in multitenant mode, Loki should be started with auth_enabled: true.
The concept of multitenancy comes into play when the same log collector is deployed to multiple components of a platform but a separation is required. This is often done to fulfill security requirements, define data access patterns, or simply to enforce best practices. To illustrate a practical application of this concept, we will consider Fluentd, a commonly used open source log collector that supports the concept of tenant.
The tenant field also supports placeholders, so it can dynamically change based on tag and record fields. The following snippet shows an example of setting the tenant based on a Kubernetes pod label (edited for readability). Refer to the official documentation for additional details.
At the time of writing, the Grafana/Loki stack ships with Promtail, an agent that sends the contents of local logs to the Loki instance. If you are using the out-of-the-box Promtail configuration or are generating logs from a custom application using the Loki API, setting the previously mentioned X-Scope-OrgID header might be challenging. A possible solution to this can be to add the authentication header with a proxy.
In this example, we are using NGINX, a popular proxy and reverse proxy option, that we configured as an ingress controller for Amazon Elastic Kubernetes Service (Amazon EKS). This setup lets us manage multiple DNS records automatically and create different Loki endpoints defining different ingress resources:
Using Grafana organizations, we can go a step further and associate the different tenants/DNS entries to different Grafana organizations.

Test
To test this setup, let’s generate some logs using different endpoints. For the purpose of this test, we are generating dummy entries using curl:
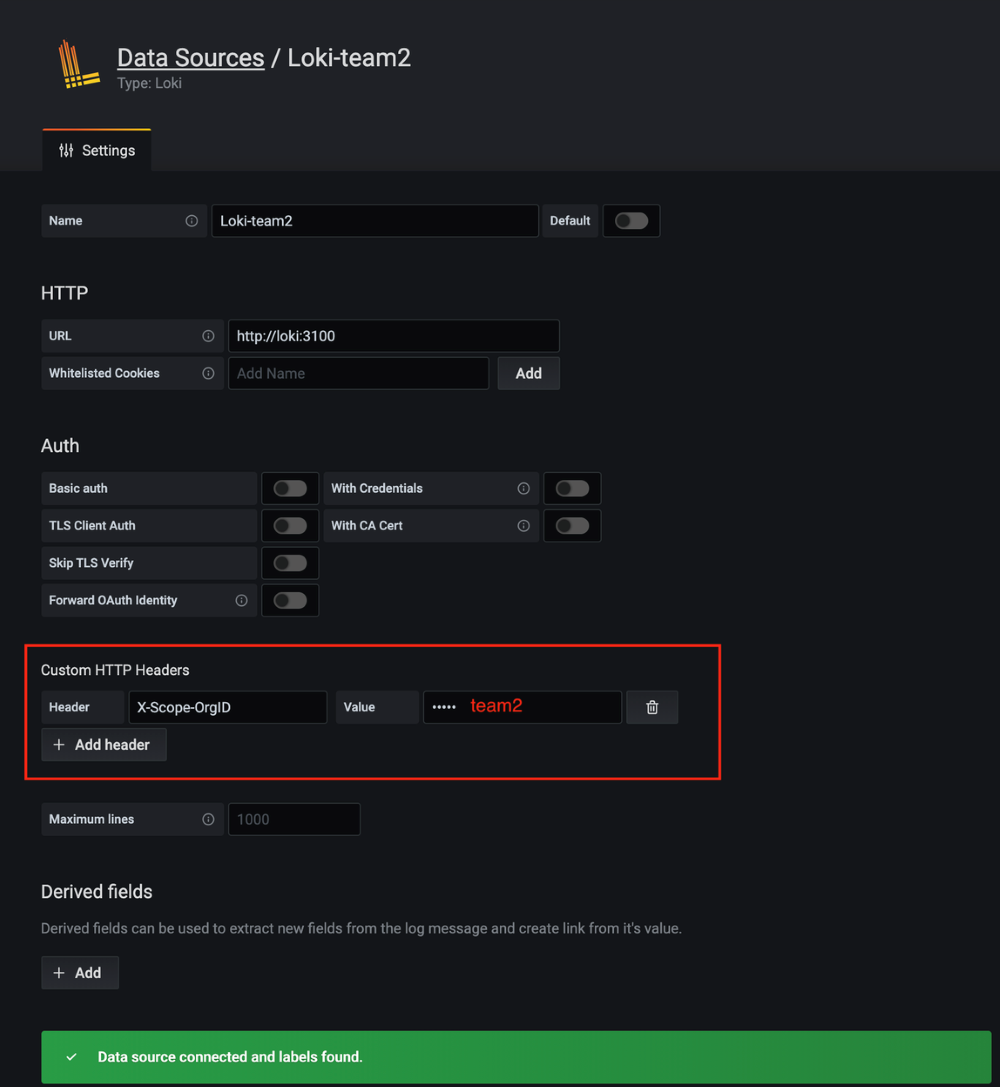
The Grafana console shown in the following images shows how every set of logs can only be queried by the corresponding data source:
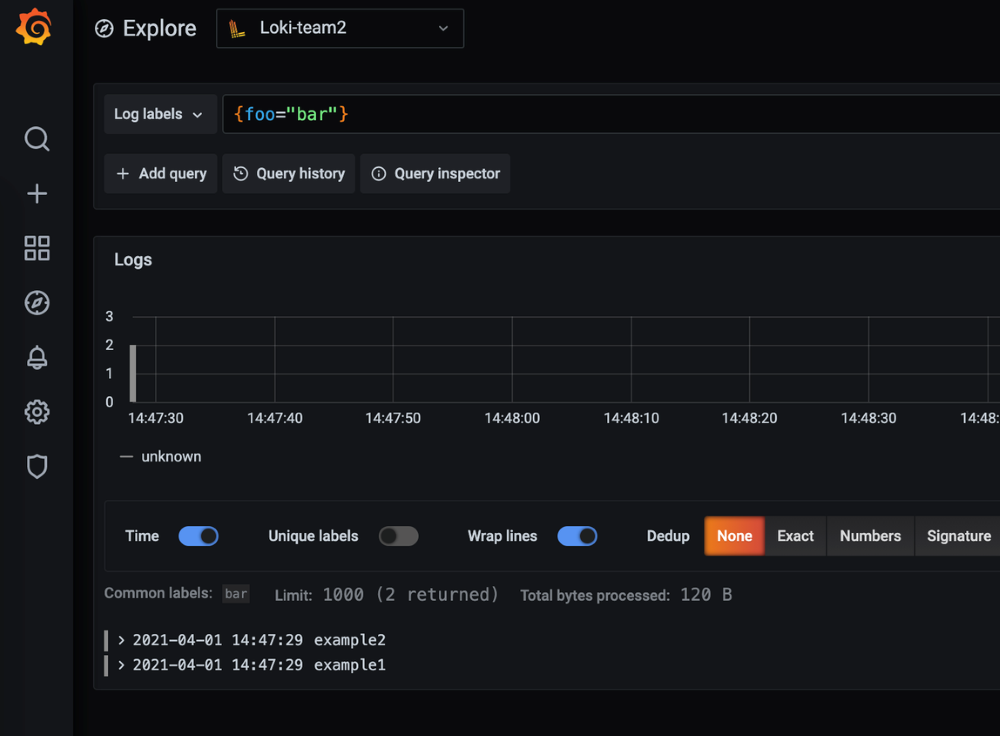
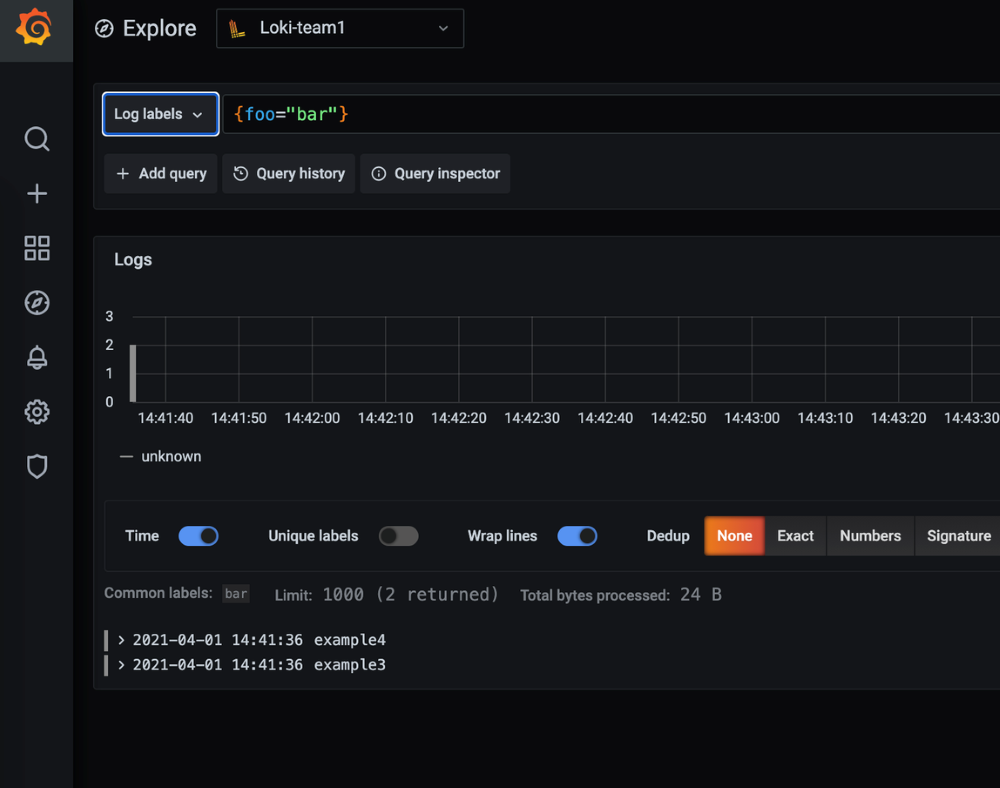
Note: The Loki data source in Grafana must be configured with the appropriate X-Scope-OrgID matching the Fluentd configuration or the value injected trough the proxy.
Security considerations
The X-Scope-OrgID header should be treated as a secret and, therefore, should not be stored in clear text inside configuration files or in the code repository. Several options are available for encrypting the values in your code repository. Some of the most commonly used ones, for example, are Sealed Secrets and Mozilla SOPS.
Loki also supports a number of backend and storage options. By default, a traditional block storage option is used, such as Amazon Elastic Block Store (Amazon EBS) or Amazon Elastic File System (Amazon EFS); however, Amazon Simple Storage Service (Amazon S3) can be used as persistent storage in conjunction with Amazon DynamoDB (further details can be found in the official documentation). All of these options can and should be configured for encryption at rest using AWS Key Management Service (AWS KMS).
Tip: If you are hosting Grafana and Loki on Amazon EKS, envelope encryption for secrets can add an additional layer of security using AWS KMS to encrypt secrets that are stored using the Kubernetes secrets API.
Conclusions
The possibility of consolidating monitoring within a single account, while maintaining data separation, can simplify operations and help maintain data compliance. Loki, in conjunction with Grafana, can offer a new approach at log management and be configured as a single entry point for application and platform logs.
Loki can be installed with Grafana and Prometheus, or as standalone component taking advantage of Amazon Managed Grafana, which is a fully managed service developed with Grafana Labs and based on open source Grafana. You can check out the official product page for further details.