Networking & Content Delivery
Calculating data transfer leveraging Amazon VPC flow logs
Introduction
There are several factors that contribute towards your overall costs incurred in AWS cloud. When it comes to networking, many customers ask about data transfer charges. You pay a Data Transfer charge when you send data out from AWS to Internet, between AWS Regions, or between Availability Zones (AZ).
Today, there are multiple ways to determine your overall costs in AWS. When your cost and usage go above a certain budget limit, you can use services like AWS Cost Explorer or AWS Cost & Usage Reports to understand what factors are affecting your costs. The AWS web page on Cloud Economics is a fantastic resource for a detailed, holistic look at your environment and can help you identify areas where optimization will make the most difference. However, these resources and solutions do not provide real-time updates for data transfer, or any details on the actual resources (or IP addresses) that contribute towards the data transfer costs between Availability Zones.
In this post, we will look at a solution that uses VPC flow logs to evaluate data transfer between the Availability Zones where your Amazon Virtual Private Clouds (VPCs) sit inside a Region. This solution is good for environments that have chatty applications distributed across multiple Availability Zones that are transferring a lot of data between them. We use the Contributor Insights feature of Amazon CloudWatch to analyze your data transfer. We use the results to calculate cost estimates in real time. The time-series visualizations created by CloudWatch show the top factors influencing your data transfer. The solution shown in this post also publishes the data transfer estimates as a CloudWatch Contributor Insight metric. This metric is set up with an alarm and integrated with your notification system—triggering an alarm when a metric crosses certain threshold. We designed our solution for a multi-account setup.
Architecture
In this multi account setup, we use flow logs to be the data source that captures all your VPC traffic with CloudWatch destination created in Hub account. Typically, a Hub account is where you deploy AWS Transit Gateway and AWS Direct Connect, consolidate your VPC endpoints and DNS resolver endpoints, and so on. We use Amazon Kinesis to stream the flow logs from the spoke accounts to a CloudWatch destination present in hub account.
We use an Amazon DynamoDB table in the hub account to store the mapping of the subnets to AZ’s for all VPCs across all accounts. The table supports any number of VPCs and/or accounts. In spoke accounts, LoadAZCIDR and Update-Subnet-AZ lambda functions are created. The LoadAZCIDR function initializes the DynamoDB with the subnet mapping of the spoke account. We trigger the Update Subnet-AZ lambda function on any update activities to subnets within the spoke VPC (create subnets, delete subnets, etc.). This lambda function keeps the DynamoDB in the hub account up to date.
The Data Transfer lambda Calculator function is triggered on any new events in the flow log. This function then parses the flow log entries and measures the data transfer between Availability Zones and publishes it as a Contributor Insight metric to CloudWatch. Alarms are configured with a pre-defined threshold for data transfer and integrated with notification systems, such as Amazon Simple Notification System, to send alerts. We then analyze the data transfer and create time-series visualizations to provide a view of the top contributors influencing the data transfer between Availability Zones. The architecture for our solution is shown in Figure 1.
Figure1 : An architecture for a multi-account setup where information captured in VPC flow logs is leveraged to evaluate the data transferred between the AZs
Implementation
Our solution uses AWS CloudFormation to build the resources in the hub and spoke accounts. We use AWS Identity and Access Management (IAM) for cross account roles, lambda to calculate the data transfer between Availability Zones, and DynamoDB for storing the mapping of subnets, its Classless Inter-Domain Routings (CIDRs), and Availability Zone details. Finally, we use CloudWatch log groups with the Contributor Insights feature to create time series visualizations. The repository for the code used in our solution can be found here.
Single Account Setup
The deployment for a single account setup is as follows:
- Upload the code for lambda functions and the lambda layer to an Amazon Simple Storage Service (S3) bucket in the Region where you want to deploy this infrastructure. This includes calculator.zip, loadAZCidr.zip, CreateVpcFlowlogs.zip and UpdateDDBTable.zip.
- Log on to the AWS Management Console. Select the CloudFormation service.
- Launch the CloudFormation stack using the template single-account-deployment.yml.
- Provide the S3 bucket name that you used in step 1 and the IDs of the VPCs that you want to watch, to see the data transferred between Availability Zones.
- Next, acknowledge the permissions required to provision IAM roles, and cross account permissions granted via Organization policies and create the stack.
- Select the Resources tab in the center pane. Validate that all the resources are CREATE_COMPLETE and the stack is in CREATE_COMPLETE state. A sample of the stack parameters in a single account setup is shown in the Figure 2 that follows.
Figure 2 : Parameters for evaluating data transfer between Availability Zones in DTAZ-single- account stack
7. Next, configure CloudWatch Contributor Insights and its associated alarms. To do this, perform:
- Log on to the AWS Management Console. Select the CloudWatch service.
- Select Contributor Insights on the left pane. In the create rule wizard, choose custom rule.
- Provide an appropriate rule name.
- Select the log group of your calculator lambda function (rcalculatorlambda) that was created by cloudformation stack in step 3.
- Select log format as JSON, Contribution as event.srIp and event.destIp
- Aggregate on SUM and event.bytes.
- Select create rule in enabled state and then choose Create. Figure 3 provides the Contributor Insight rule as an example.
Figure 3 : A Contributor Insight rule to evaluate data transfer between AZs based on CloudWatch Log group
8. To create alarms for your Contributor Insights metrics:
In the CloudWatch console, from the left navigation pane, choose Contributor Insights and then choose the rule.
- Choose Actions and then choose View in Metrics.
- Choose Unique Contributors. This metric will be graphed in CloudWatch metrics.
- Choose the alarm icon in the row of the metric. For example, create an alarm when there are more than 1GB of data transfer observed per minute between a particular source and destination.
- Choose Create. Figure 4 provides a Contributor Insight as a metric for data transfer between AZs.
Figure 4 : A Contributor Insight as a metric for data transfer between AZs.
Note: The data points are in number of bytes (K – thousands of bytes, M – millions of bytes, etc)
For more information, see Graphing Metrics Generated by Rules in the Amazon CloudWatch User Guide.
Multi-Account Setup
The deployment comprises of three steps for a multi account setup. We have outlined the details of each step below:
Pre-requisites:
1. Setting up IAM roles and policies:
All the stacks launched must be prefixed with DTAZ. For example, create stacks with names – DTAZ-pre-role, DTAZ-Data-Transfer-Calculator and DTAZ-Data-Transfer-Update etc.
2. Spoke account:
- Log on to the AWS Management Console of your spoke account. Upload loadAZCidr.zip, CreateVpcFlowlogs.zip and UpdateDDBTable.zip file to s3 bucket that stores your lambda code.
- Log on to the AWS Management Console of spoke account. Select CloudFormation service.
- Launch a CloudFormation stack using the template pre-roles.yml . This creates the execution roles required for the lambda functions.
- Next, acknowledge the permissions required to provision IAM roles, and cross account permissions granted via Organization policies and create the stack.
- Select the Resources tab in the center pane. Validate that all the resources are CREATE_COMPLETE and the stack is in CREATE_COMPLETE state. Figure 5 shows a pre-role stack along with its parameters.

Figure 5 : An example of parameters for DTAZ-pre-role stack.
Step 1 : Set up the Hub Account
- Upload the code for lambda function, calculator.zip, to the S3 bucket in the Region where you want to deploy the infrastructure.
- Select CloudFormation service. CloudFormation stack using the template data-transfer-calculator.yml This creates the DynamoDB table and the central lambda function that calculates the cost.
- Select the Resources tab in the center pane. Validate that all the resources are CREATE_COMPLETE and the stack is in CREATE_COMPLETE state. Figure 6 provides details on parameters for DTAZ-Data-Calculator stack.
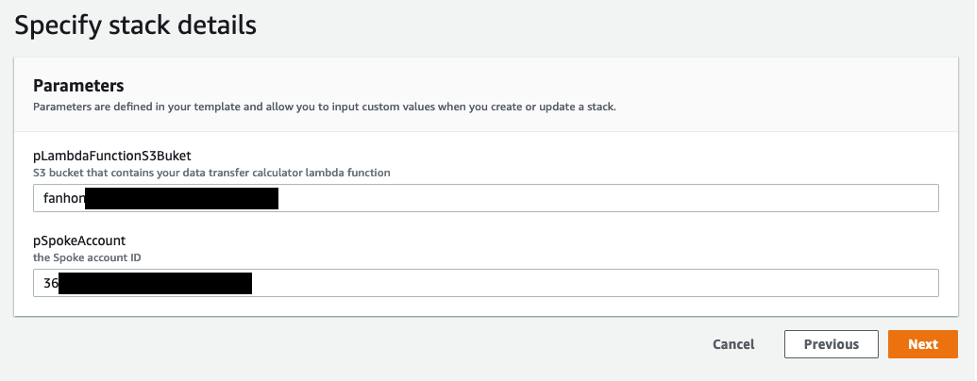
Figure 6 : An example of parameters for DTAZ-Data-Transfer-Calculator stack.
Step 2 : Set up the Spoke Account
- Copy the outputs from the stack provisioned by the data transfer calculator template in the hub account. This will serve as inputs to the next step.
- Select CloudFormation and launch a CloudFormation stack using the data-transfer-calculator-update.yml template. This creates a lambda function and a custom resource. The Lambda function is triggered by a AWS CloudTrail API for any subnet creation activity and keeps the DynamoDB up to date with subnet – AZ mapping. The custom resource and the backend lambda function will push the initial data (current subnet AZ IDs and CICD blocks) to DynamoDB table.
- Select the Resources tab in the center pane. Validate that all the resources are CREATE_COMPLETE and the stack is in CREATE_COMPLETE state. Figure 7 provides details on parameters for DTAZ-Data-Calculator stack.

Figure 7 : An example of parameters for DTAZ-Data-Transfer-Update stack.
Step 3 : Set up the Contributor Insights and Alarms in CloudWatch
Next, configure CloudWatch Contributor Insights metrics for data transfer between Availability Zones, and its associated alarms as described in the single account setup. For more information, see Graphing Metrics Generated by Rules in the Amazon CloudWatch User Guide.
Cleanup
To avoid ongoing charges, delete the resources you created. Go to the AWS Management Console, identify the CloudFormation stack you launched. Select delete stack. This operation will delete the resources you created (the Dynamo DB, the lambda functions, Contributor Insights rules, CloudWatch Logs Insights rules, and alarms).
Conclusion
In this post, we introduced a solution using VPC flow logs to track data transfer charges between Availability Zones within a VPC or across VPCs in an account. The solution supports a multi account setup. We publish Data Transfer as a CloudWatch contributor insight metric. We then used CloudWatch alarms and set a threshold and integrated it with SNS. We also integrated our solution with CloudWatch Contributor Insights to determine top contributors for data transfer.
We hope this post is helpful and we look forward to hearing about how you use this feature.
About the Authors

Shiva Vaidyanathan
Shiva Vaidyanathan is a Senior Cloud Infrastructure Architect at AWS. He provides technical guidance, design and lead implementation projects to customers ensuring their success on AWS. He works towards making cloud networking simpler for everyone. Prior to joining AWS, he has worked on several NSF funded research initiatives on how to perform secure computing in public cloud infrastructures. He holds a MS in Computer Science from Rutgers University and a MS in Electrical Engineering from New York University.

Stan Fan
Stan Fan is a Premium Support Engineer based in Sydney Australia. He focuses on fixing customer’s CICD issues, enabling them build resilient and scalable devops practices in cloud.