Networking & Content Delivery
Amazon EC2 instance-level network performance metrics uncover new insights
Introduction
Amazon EC2 provides instance-level metrics that measure CPU, disk, and network performance. These metrics include bytes and packets in/out and collected by default and can be viewed in Amazon CloudWatch. Amazon EC2 has recently announced additional high-resolution instance level network performance metrics for Elastic Network Adapter (ENA). With these new metrics you can gain insights into traffic drops when network allowances are exceeded.
When you can only see instance network utilization, it is difficult to see if you are exceeding various EC2 instance network allowances. This lack of visibility can result in an increase in issue MTTR (mean time to resolution), and also hinders instance benchmarking (from network perspective) during instance deployment.
Examples of instances that fall into these categories are network appliances, such as Firewalls, Intrusion Detection and Prevention (IDP) systems, and Load Balancers. These appliances are often licensed though AWS Marketplace and deployed within a Virtual Private Cloud (VPC) as EC2 instances. They use AWS Partner-provided Amazon Machine Images (AMI), or need customization by deployment of software and packages on Amazon-provided or community AMIs. These network appliances are both compute and network I/O intensive. Other examples of compute and network I/O intensive workloads are High Performance Compute (HPC), Machine Learning, and Big Data applications.
Regardless of the workload type, instance right sizing decisions that meet the needs of both network and compute are crucial. There are several factors that contribute to the decision-making process. One of the contributing factors in this decision is the overall performance of the EC2 instance to provide the service deterministically and consistently. Performance of the EC2 instance depends on network adapter type used (ENA or EFA), network performance allowances that are dependent on instance type.
In this blog, we explain how these metrics can be collected in real time, interpreted, and used to initiate alerts using CloudWatch. We will dive into some common use-cases as well.
Network Performance Metrics
Additional instance level network performance metrics are available on instances using ENA both for Windows and Linux operating systems. These include:
- bw_in_allowance_exceeded and bw_out_allowance_exceeded indicates the number of packets that are queued or dropped because of instance aggregate bandwidth exceeded BW allowance for the instance.
- pps_allowance_exceeded indicates number of packets queued or dropped due to Packet Per Second (PPS) exceeding the allowance for the instance. PPS allowance is enforced separately to the overall bandwidth allowance and, while the instance may still be under overall bandwidth allowance, the PPS allowance may exceed if the mean packet size is small.
- conntrack_allowance_exceeded indicates the number of packets dropped due to exhaustion of tracked session allowance for the instance, new sessions will fail to establish once this allowance is exceeded. Sessions are restored once instance session count drops below the allowance.
- linklocal_allowance_exceeded indicates the number of packets dropped due to PPS rate allowance exceeded for local services such as Route 53 DNS Resolver, Instance Metadata Service, Amazon Time Sync Service. This often points to suboptimal design choices or misconfiguration. This allowance is the same across instances.
If any of the above counters, except for linklocal_allowance_exceeded, are incrementing at a noticeable rate, it’s advisable to go up an instance family (for example, a c5n.18xlarge instead of c5n.9xlarge). All of these allowances get a bump as you increase instance size within the instance family, except for link local PPS. If the instance is behind a load balancer, horizontal scaling to add additional instances and distribute the network load is another strategy to consider. In this case, you might also use a Gateway Load Balancer to automatically scale instances of appliances that are used for inline inspection of network traffic.
New metrics support is part of ENA driver version 2.2.10 or later for Linux and 2.2.2.0 or later for Windows (2.2.2.0 will be available soon). Recent Amazon Linux 2 AMIs come with latest ENA drivers by default, eliminating the need to manually update the ENA driver. CloudWatch Agent version 1.246396.0 and later natively support export of these metrics directly from the instance. This can be used for visualization in CloudWatch dashboards, or to initiate alarms when user-set thresholds are exceeded.
These configuration guides are available to help you turn these metrics on for the instance and collect them via CloudWatch:
- Monitoring Network Performance Metrics for Linux
- Collecting Network Performance Metrics with CloudWatch
Let me take you through some real-world scenarios that take advantage of these metrics.
Scenario #1 Troubleshooting service degradation
Richard works as a Site Reliability Engineer (SRE) for a startup that has standardized on an inline Intrusion Prevention System (IPS) appliance for all north-south traffic. He has deployed this IPS appliance as an EC2 instance in a shared services VPC.
As the startup grows, he helps his teams create and deploy new applications and workloads on AWS. Richard continues to use the IPS service, but application developers start complaining about application timeouts and increased latency. Richard starts looking at existing metrics in Amazon CloudWatch for the EC2 instance. He observes normal peak CPU and memory usage (as shown in the following Figure 1), ruling out instance compute contention. Richard temporarily bypasses the IPS altogether and notices that the problem disappears, bringing the investigation back to the IPS EC2 instance.

Figure1: Shows CPU and Memory metrics from CloudWatch Dashboard, showing normal CPU and Memory levels.
Richard decides to turn on instance level network performance metrics for ENA and start publishing these as CloudWatch Metrics. The metric pps_allowance_exceeded shows increasing aggregate drop count, at the same time bw_in_allowance_exceeded and bw_out_allowance_exceeded metrics do not show any increments. This indicates that the majority of the network traffic through the IPS consists of small packets that exceed the PPS allowance of the instance well before the bandwidth allowance.
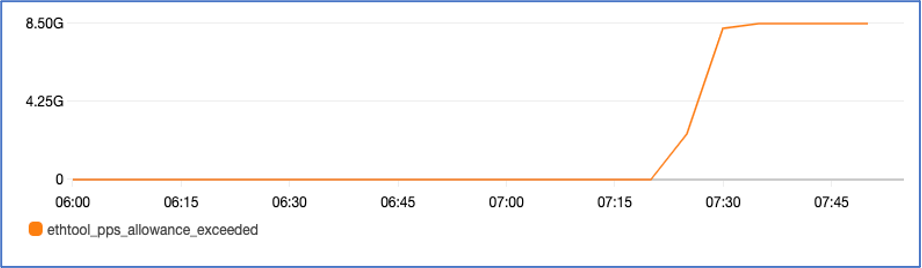
Figure2: Shows pps_allowance_exceeded on an instance. The metric shows sudden spike after 07:15.

Figure3: Shows a metric math feature for CloudWatch metric(s) for pps_allowance_exceeded.
Richard scales up the instance and sets up drop rate alarms for these metrics using the CloudWatch metric math function to watch for any future events that need his attention.
He also plans to explore horizontal scaling of EC2 instances in the future using dynamic Autoscaling using CloudWatch metrics.
EC2 instance level network performance metrics provided Richard with the insights to detect which allowances were exceeded. Without these, it could have been much more difficult to identify the root cause of the problem. Overall, these metrics helped reduce MTTR improving service availability.
Scenario #2 Benchmarking for new service rollout
Ana works for an established retail company. Her company has traditionally hosted IT infrastructure in their data centers and have only recently started migrating services to AWS. Active Directory (AD) services are a core component of their architecture and Domain Name Services hosted on the AD controllers. As many new stores are opening, she kicks off a pilot to extend additional AD controllers in the AWS Cloud.
During the project initiation phase, Ana learns about PPS allowance on the EC2 instances. These can have an effect on overall hybrid DNS design using AWS hosted AD Controllers, and the architecture needs to be designed accordingly. Ana also knows to turn on instance level network performance metrics and monitor them in CloudWatch metrics.
During the benchmarking process Ana noticed that the metric linklocal_allowance_exceeded is showing increased counts (as shown in the following Figure 4). Based on her calculation, AD server would hit these limits if all five stores utilize DNS services.
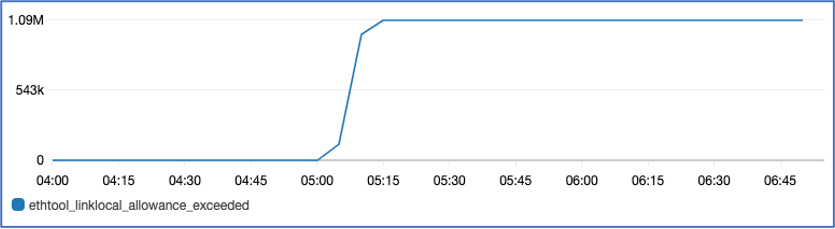
Figure4: Shows linklocal_allowance_exceeded on an instance. The metric shows sudden increase after 05:00.
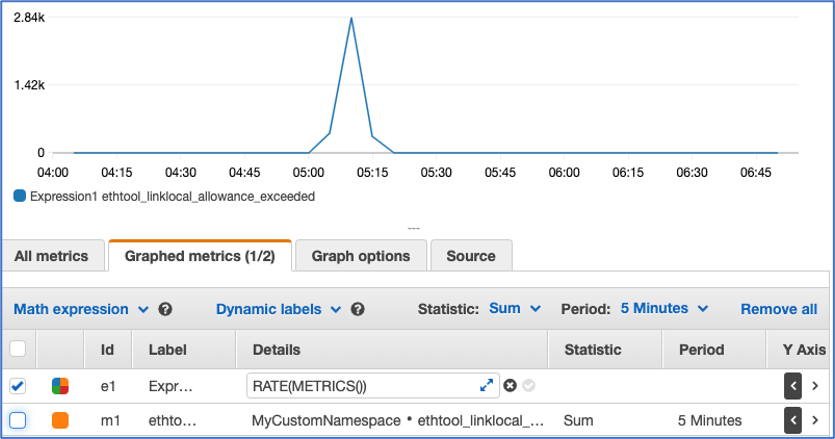
Figure5: Shows a metric math feature for CloudWatch metric(s) for link local _allowance exceeded
Ana makes changes to the network architecture and follows the best practices for Hybrid DNS by using Amazon Route 53 Resolver endpoints along with Amazon Route 53 forwarding rules to manage Hybris DNS. By using these metrics during the benchmarking process, she avoids future problems. Using tools like iperf, she runs a comprehensive benchmarking exercise on various instances to find the right instance type.
Conclusion
These new metrics give you a high-resolution picture of network performance at the instance level. They are tools that can help you resolve problems faster and expand your network with confidence.
Author the authors

Vijay Shekhar Rao
Vijay Shekhar Rao is a Senior Technical Account Manager working with large AWS enterprise customers. Before joining AWS, Vijay has spent several years architecting, building, managing, and troubleshooting complex infrastructure for critical systems. Vijay lives in Phoenix Arizona with his wife and two boys and plans to embark a road trip from coast to coast someday.

Dileep Bairraju
Dileep Bairraju is a Senior Product Manager at AWS in the VPC product team. He is passionate about improving AWS cloud networking experience to accelerate cloud adoption across various customer verticals. Before joining AWS, he has spent over decade working in the areas of SDN, Network Virtualization, Telco Cloud, Cloud Network Infrastructure. In his spare time, he likes to spend time with his family and enjoys outdoor activities.